TED gives ASX traders charts, scans, watchlists and alerts for every listed stock. I was its only developer from 2017 to 2021, and in October 2026 I started rebuilding it as TED 3. It’s live at tedta.com.au for invited users.
TED 3 (2026)
Every weekday evening one Lambda works out 136 indicators over ten years of history for about 2,000 ASX stocks. It takes about 40 seconds and costs under $1 a month on AWS. The number crunching is Python (Polars and Numba), the site is Next.js, and the charts are my own, rebuilt from the licensed library TED 2 used.
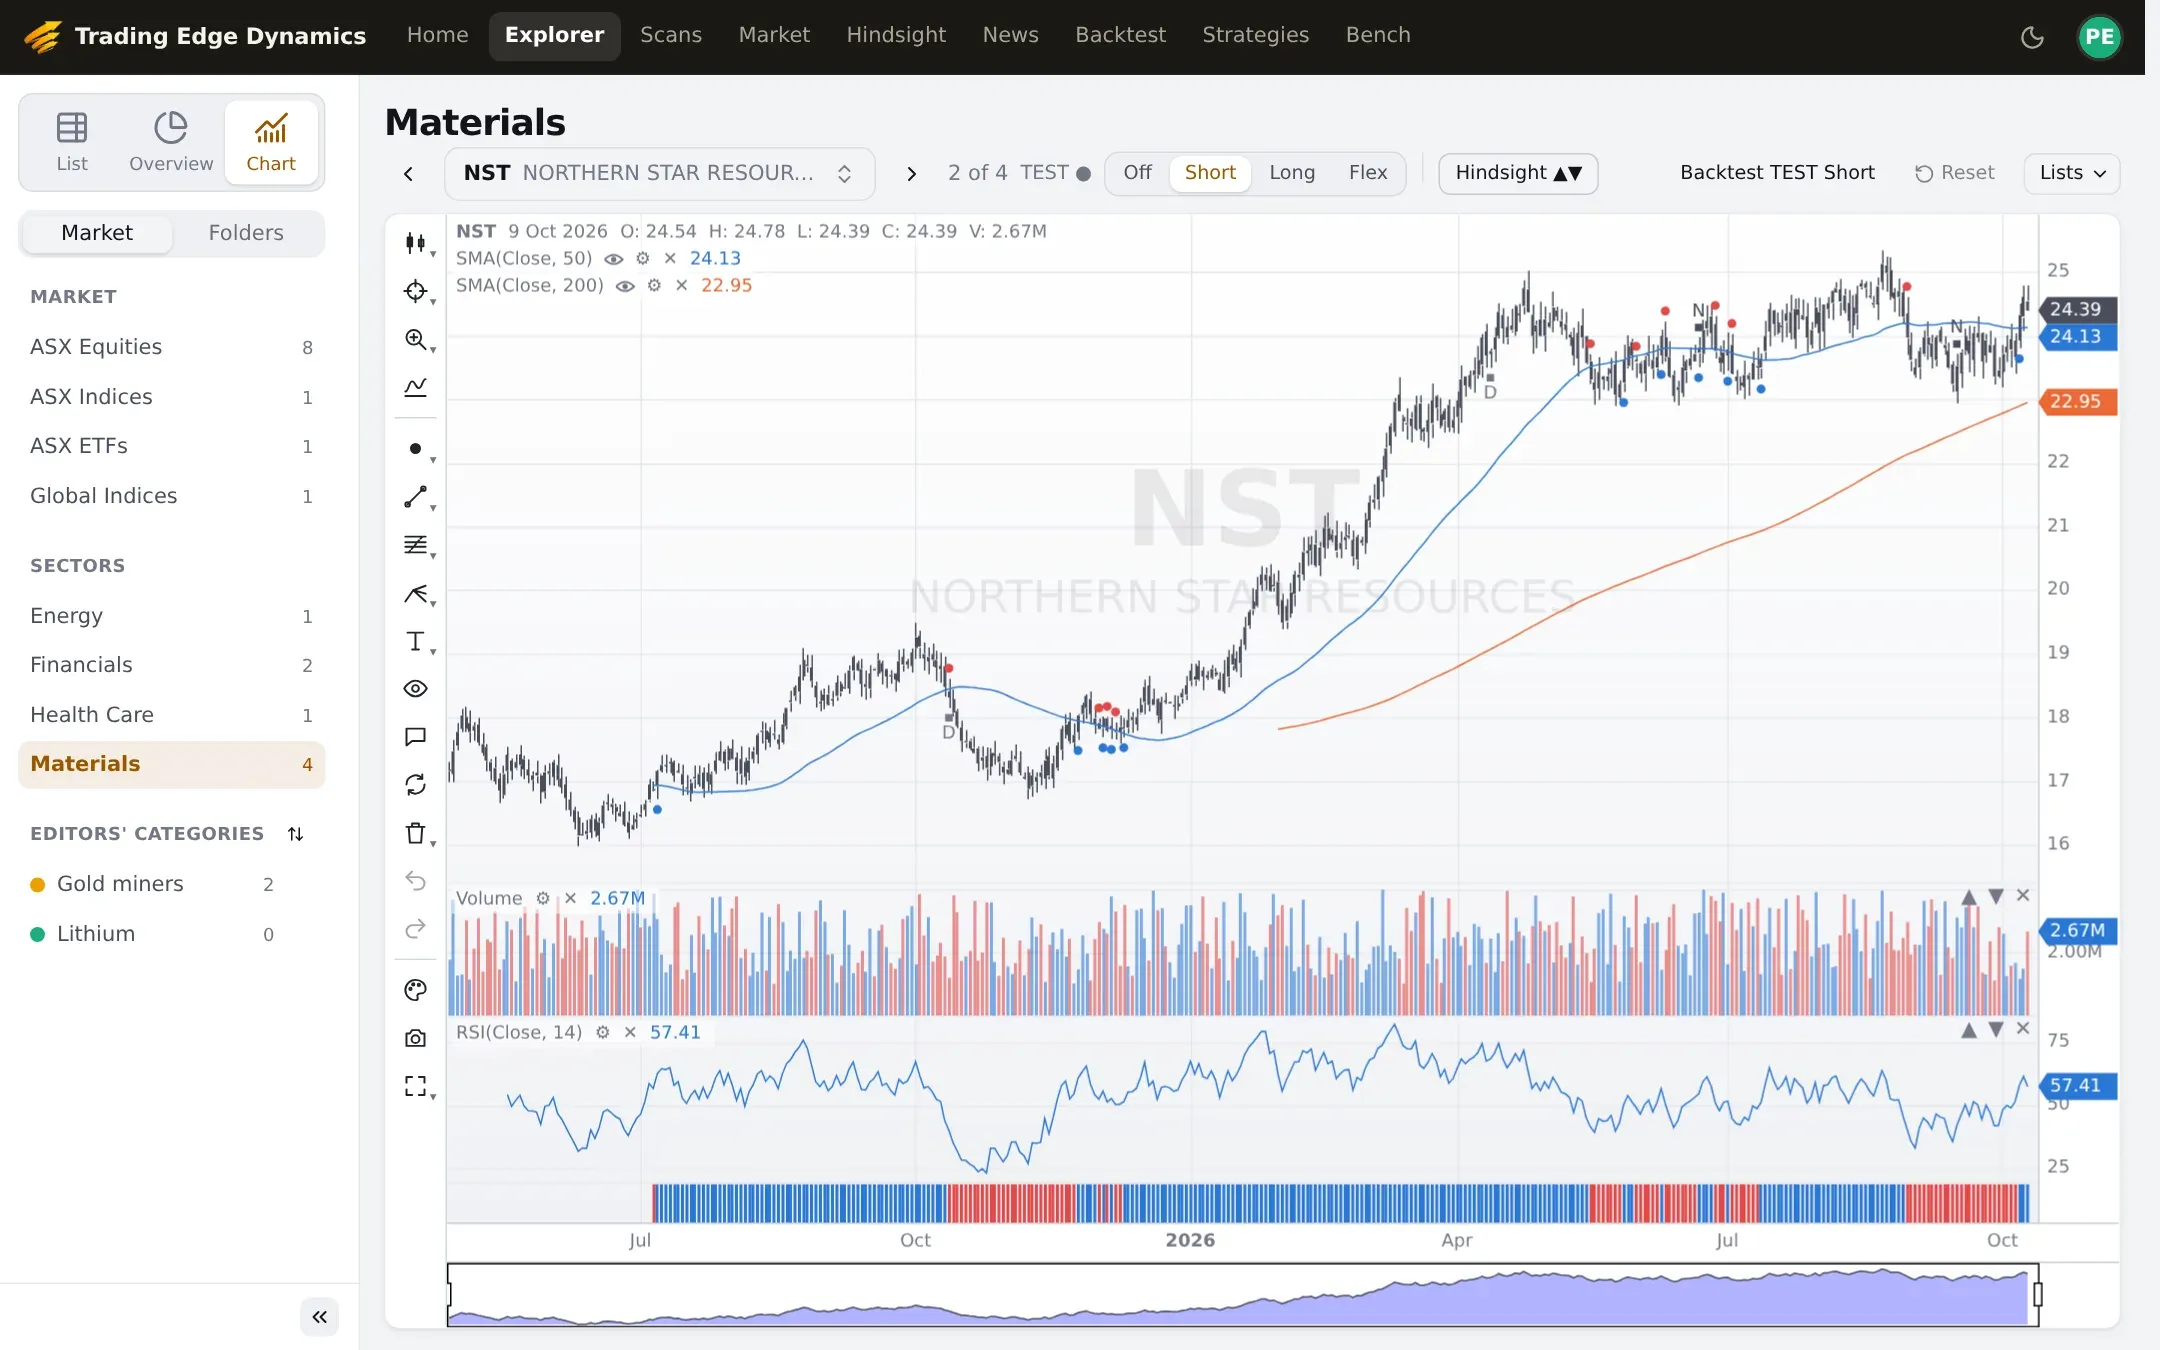
Explorer in chart mode.
You can ask for a scan or a strategy in plain English, or ask for a change to one you already have. Claude writes it, the site checks it against the same rules as the backtester, and the chat shows what changed.
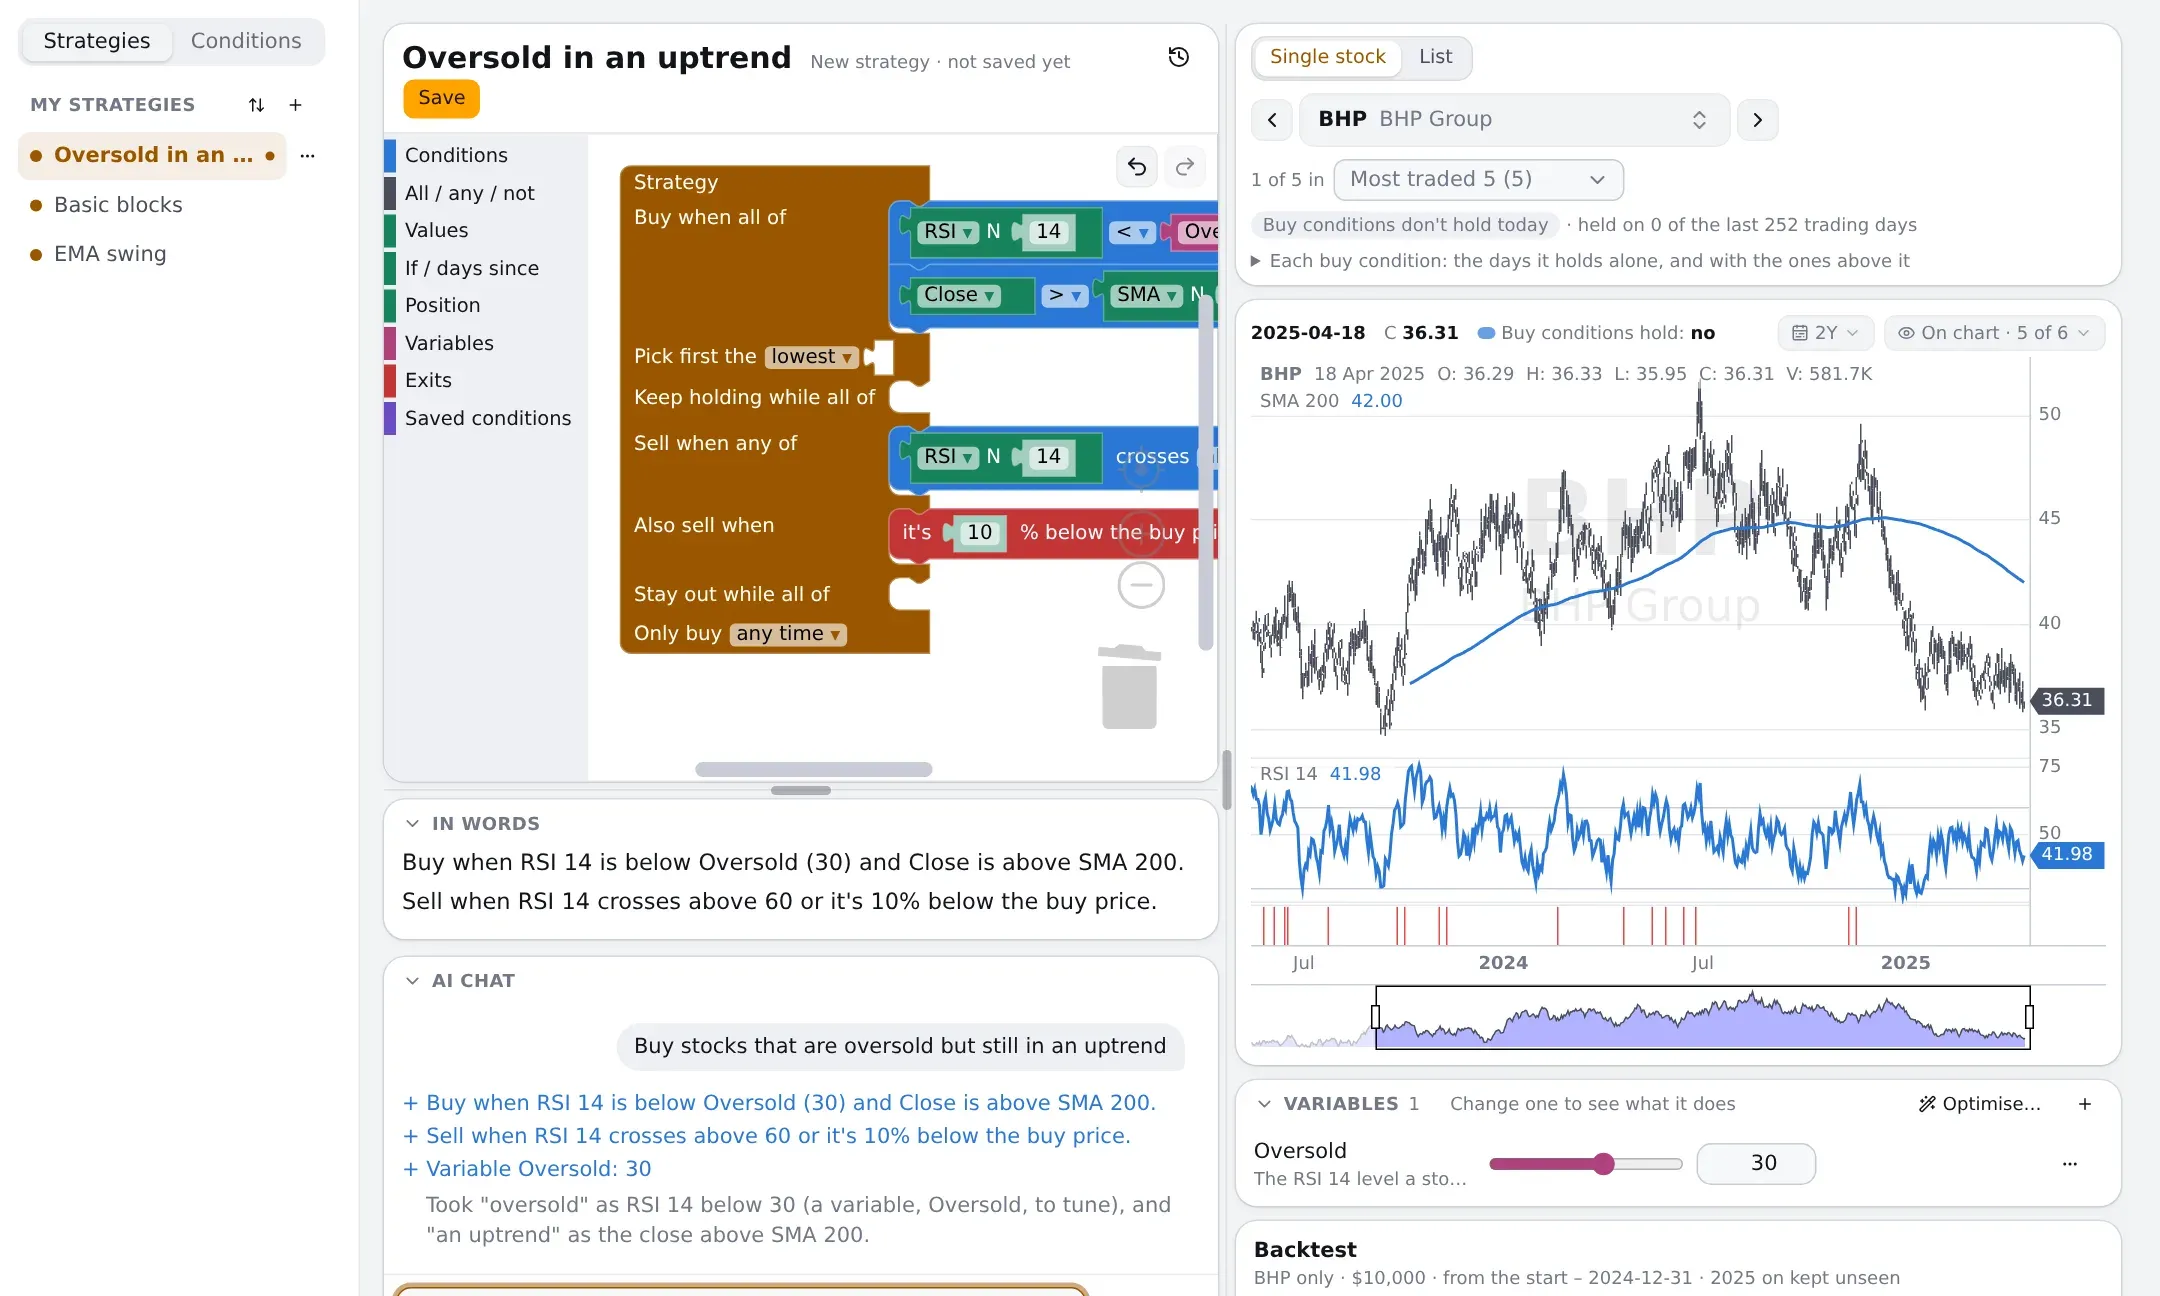
A strategy from one sentence: “Buy stocks that are oversold but still in an uptrend”.
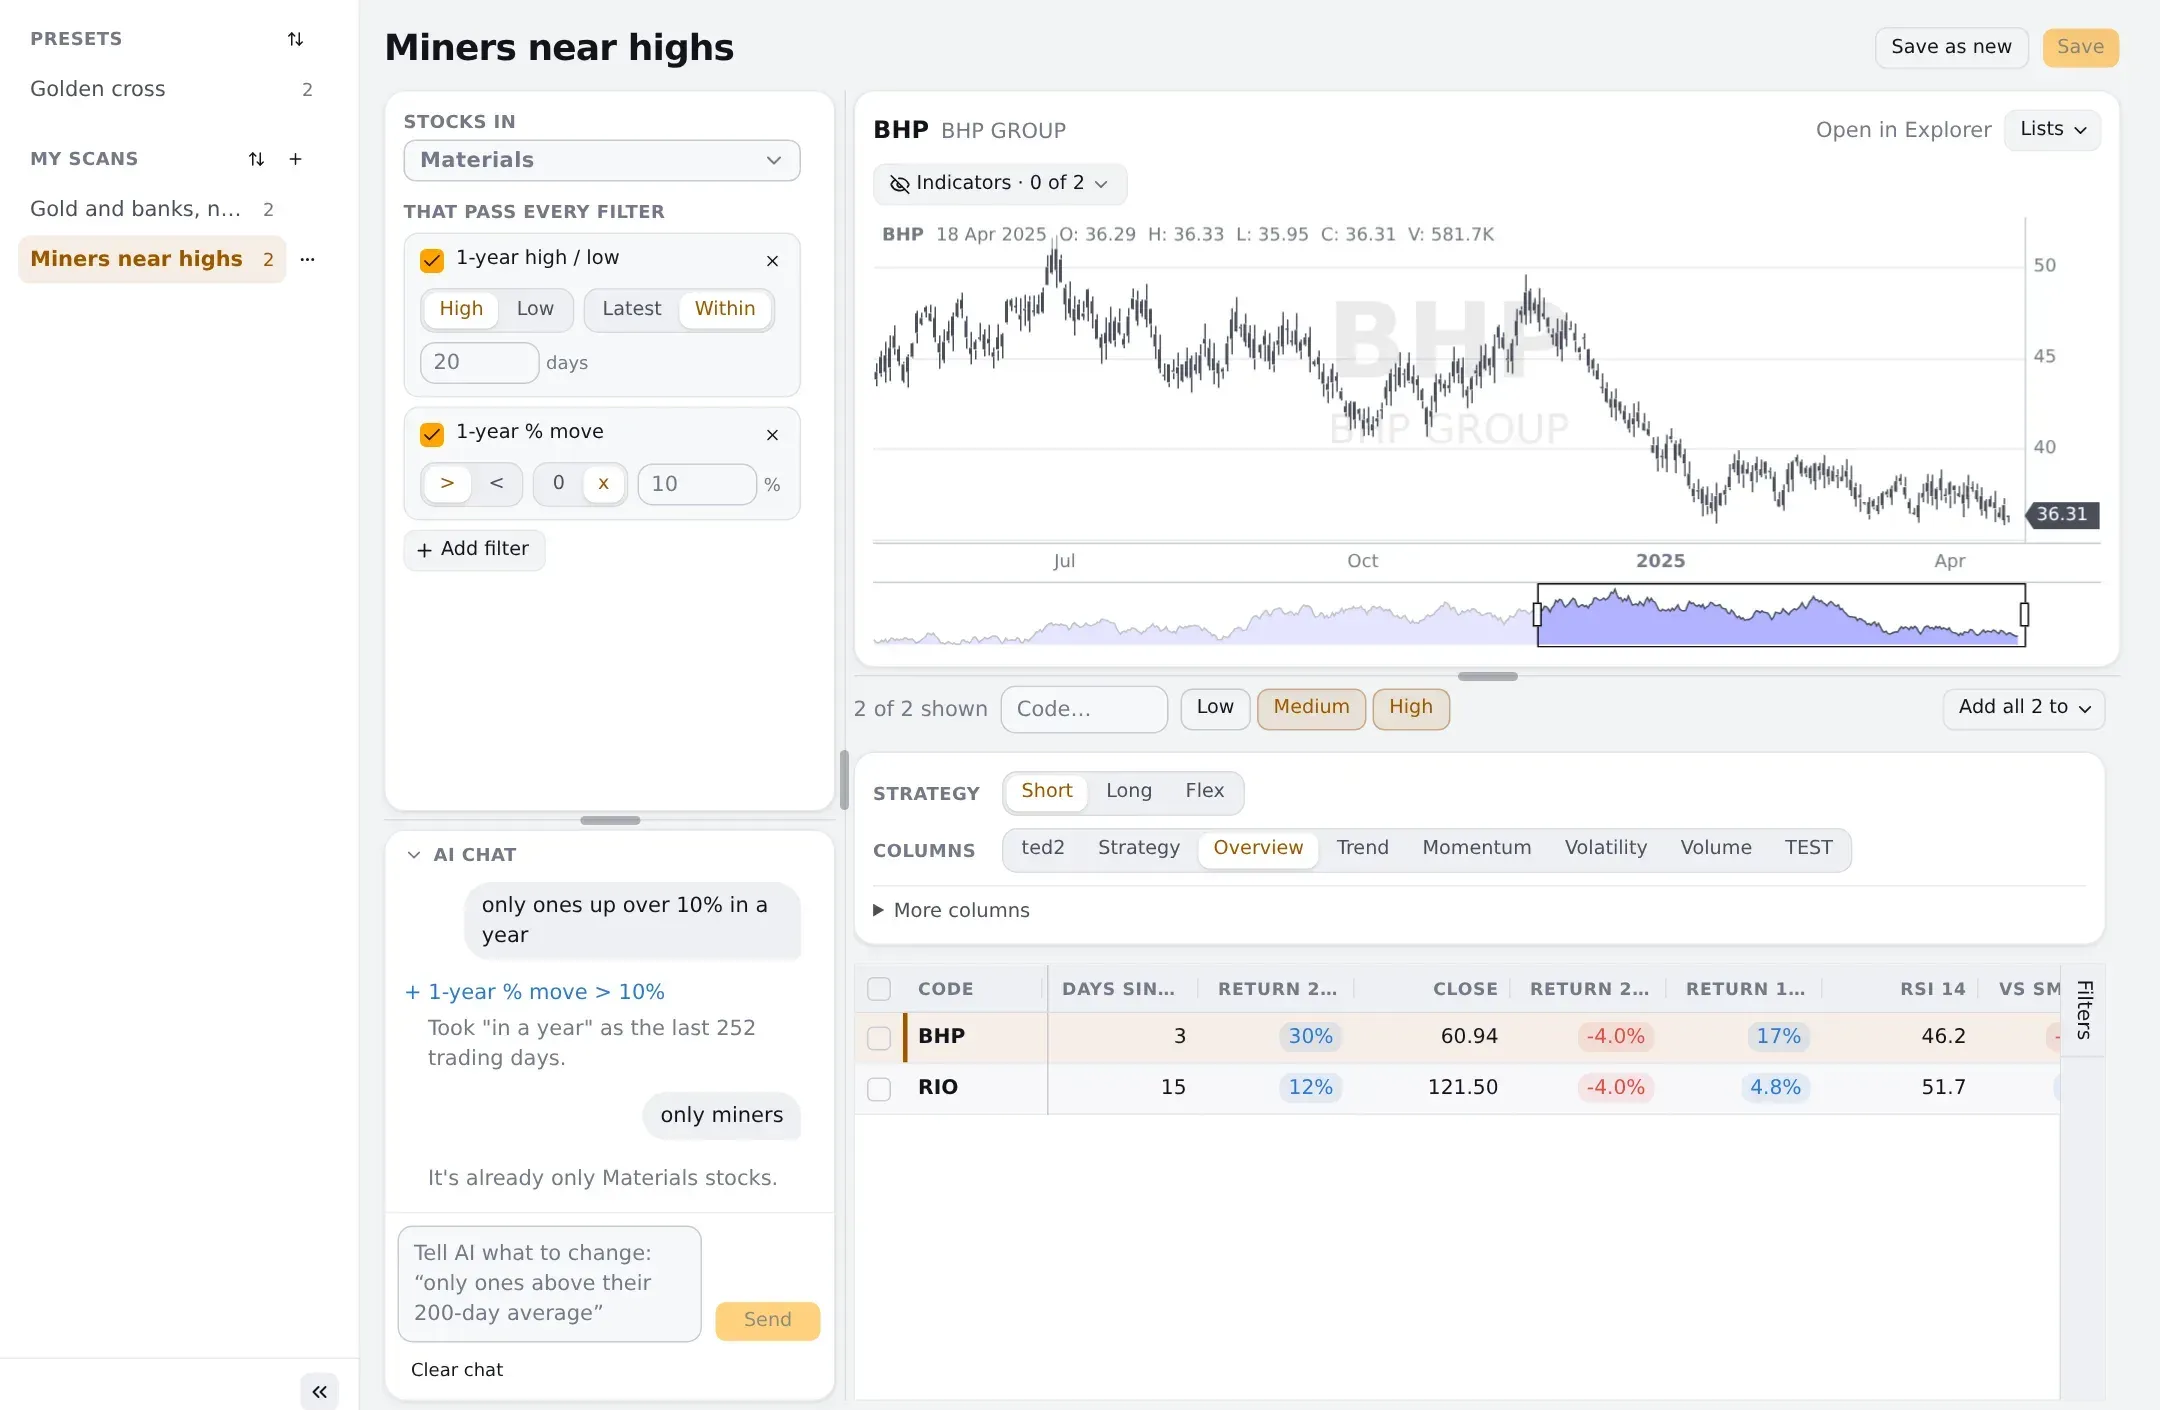
Changing a scan by asking. Asked for “only miners”, it said the scan already only looks at Materials stocks.
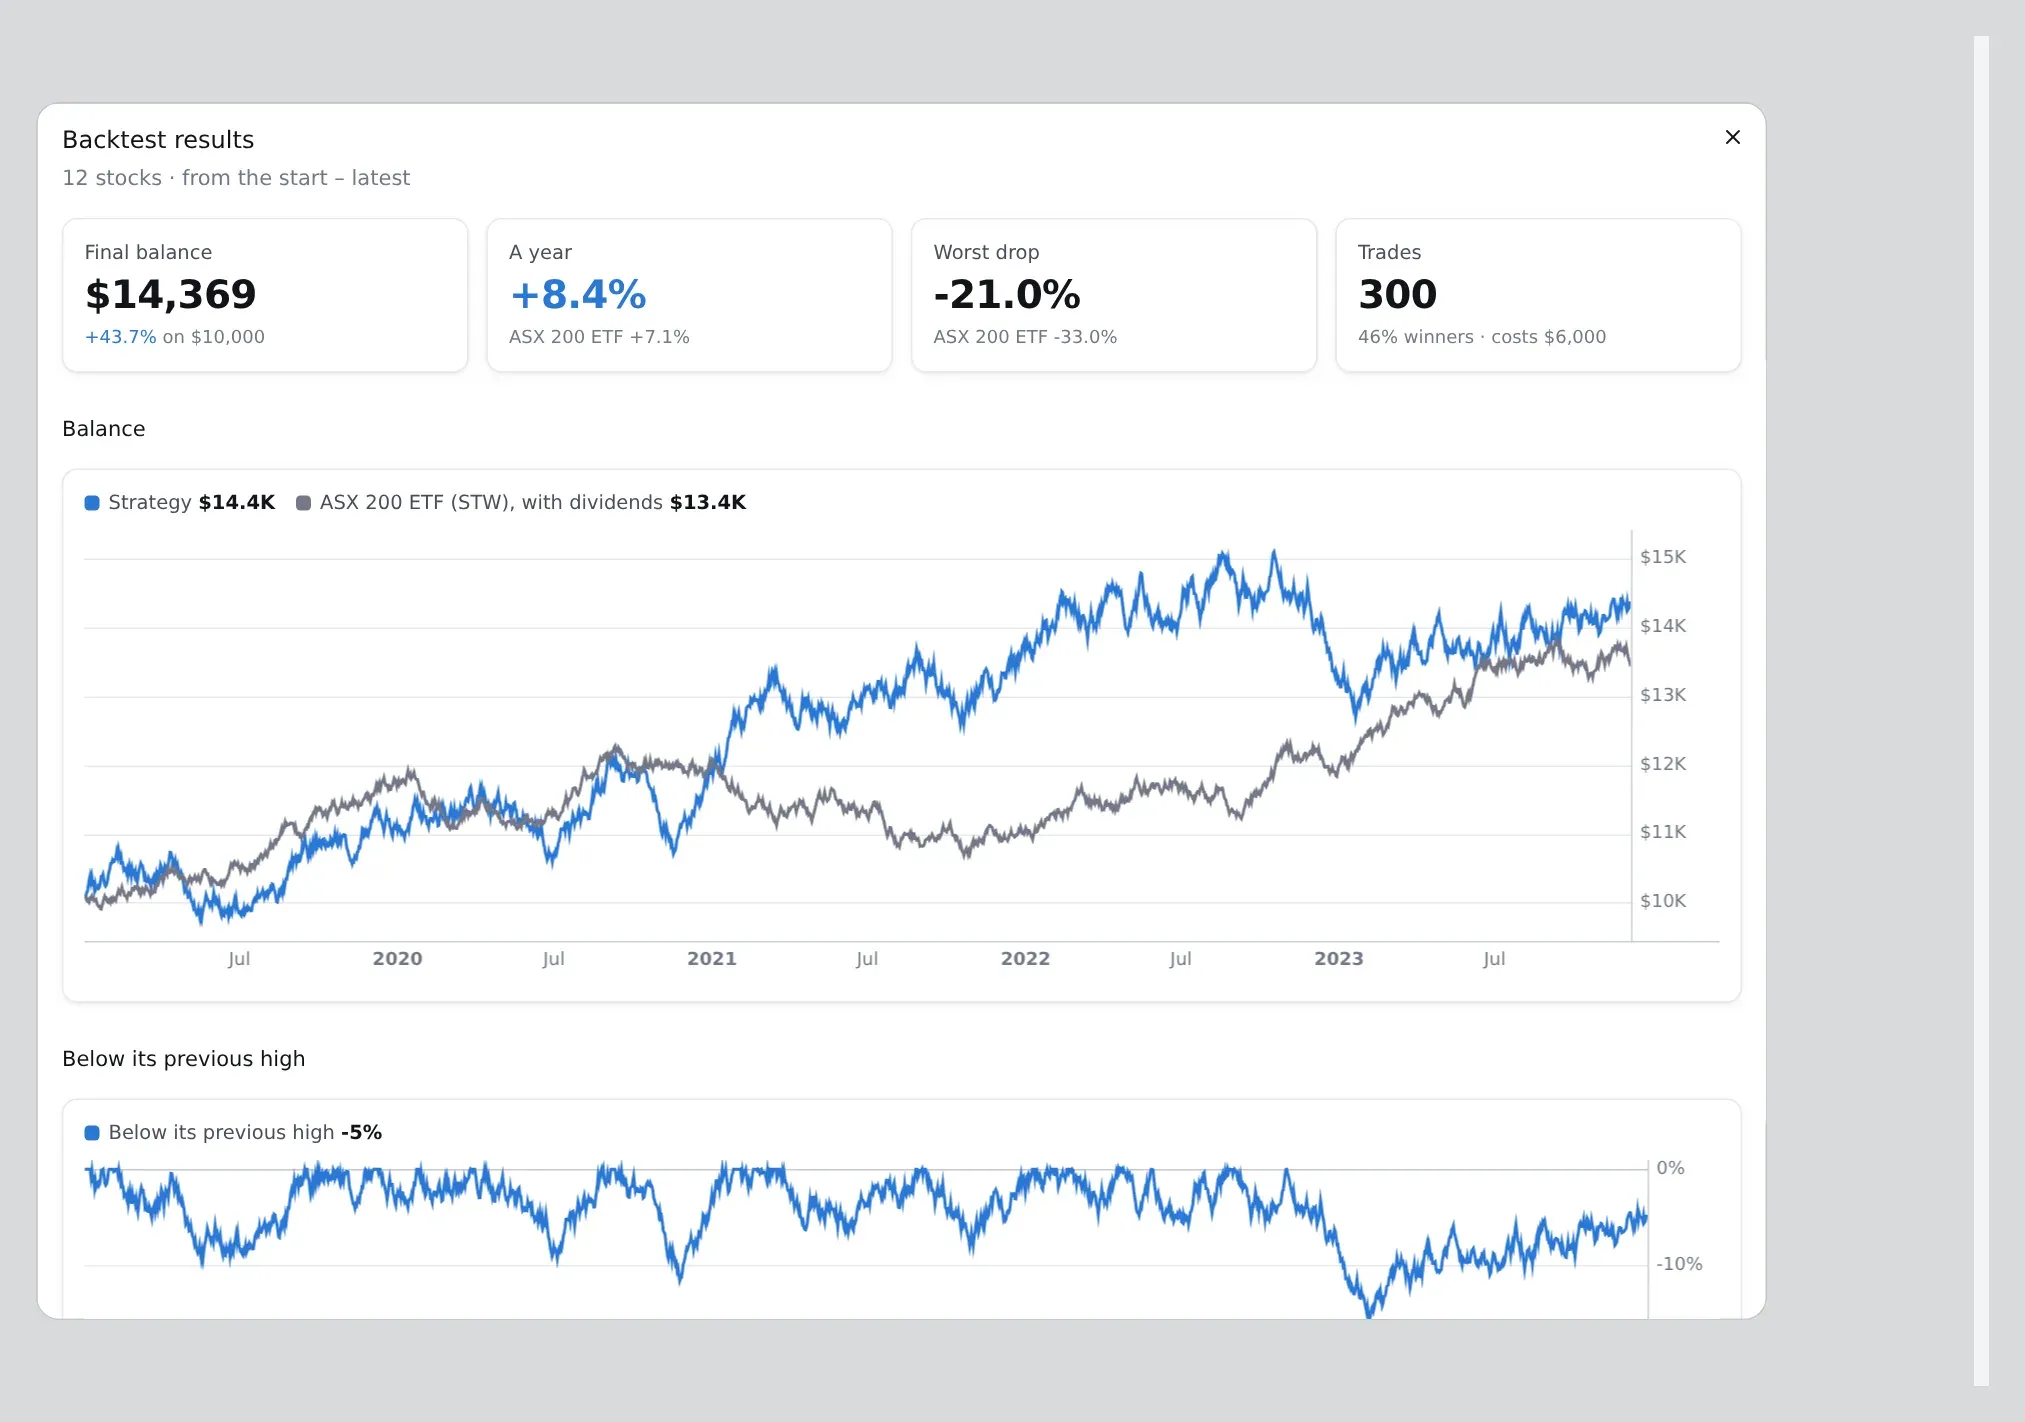
A backtest across 12 stocks, against the ASX 200 ETF.
These screenshots are from TED 3’s Storybook, which uses sample data and a stand-in for Claude.
TED 2 (2017–2021)
I replaced the original system with TED 2: an Angular front end, a GraphQL gateway, NestJS and Laravel services over MySQL, and Python jobs on AWS Batch that worked out the indicators. On top of that I built the scans, watchlists and alerts, charts, and a daily report email, and I ran it all in production.

TED 2 in 2019.